The Home dashboard is your daily command centre. It shows everything that matters: your activity list, total time, charts, and summaries – all for the selected date.
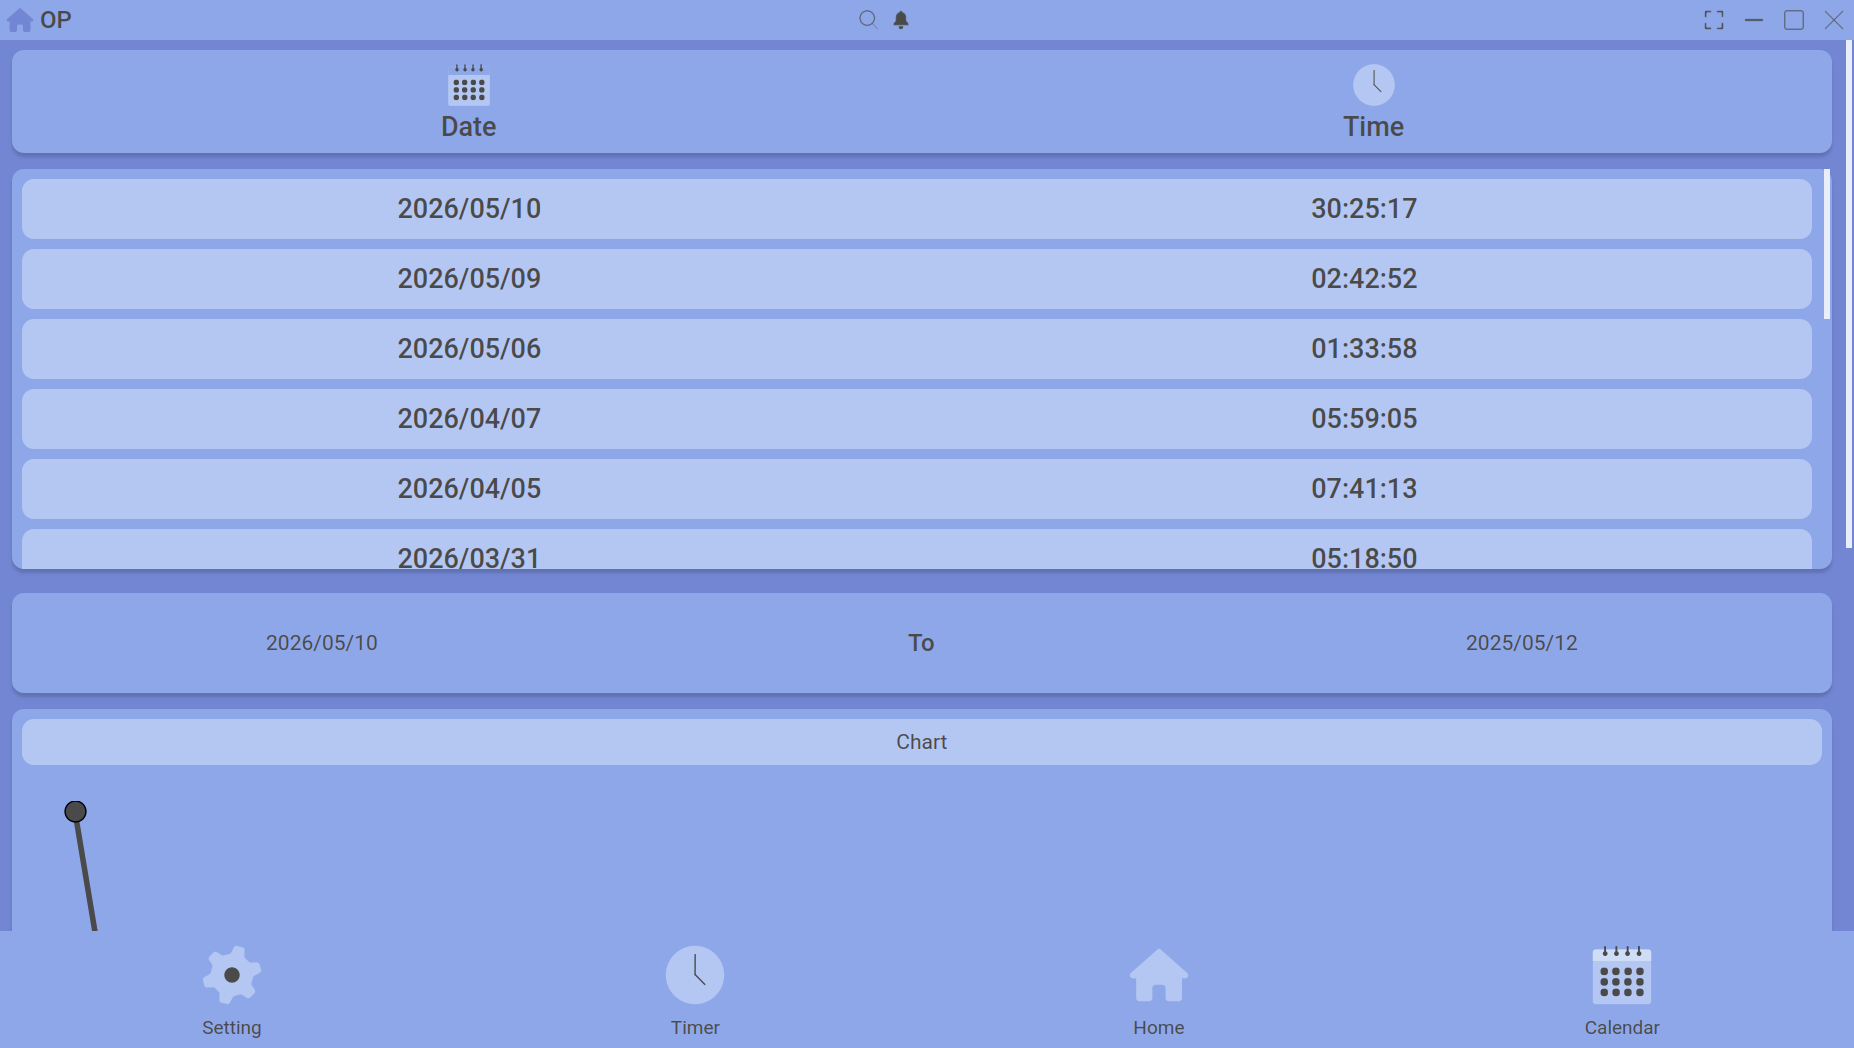
The top of the Home dashboard: activity list, total time, and daily summaries.
What you see
| Section | What it shows |
|---|---|
| Activity list | Every uploaded session for the selected date, grouped by activity name. Each item shows the number of sessions and total time. |
| Total time | The sum of all upload times for the day, giving you a quick “How much did I really work?” figure. |
| Summary cards | At‑a‑glance totals for notes, goals, and timelines added to the calendar. |
| Charts | Interactive bar or line charts showing daily totals over the week, plus per‑activity breakdowns. |
Changing the date
Use the date picker at the top to jump to any day. The entire dashboard updates instantly – activity list, totals, and charts all reflect the new date.
Diving deeper
Everything on the Home dashboard is clickable:
- Single click an activity → see its detail (start times, durations).
- Ctrl+click (or Cmd+click) two activities → compare their averages over a date range.
- Double click a session inside the detail list → open the full session deep detail panel (breaks, timelines).
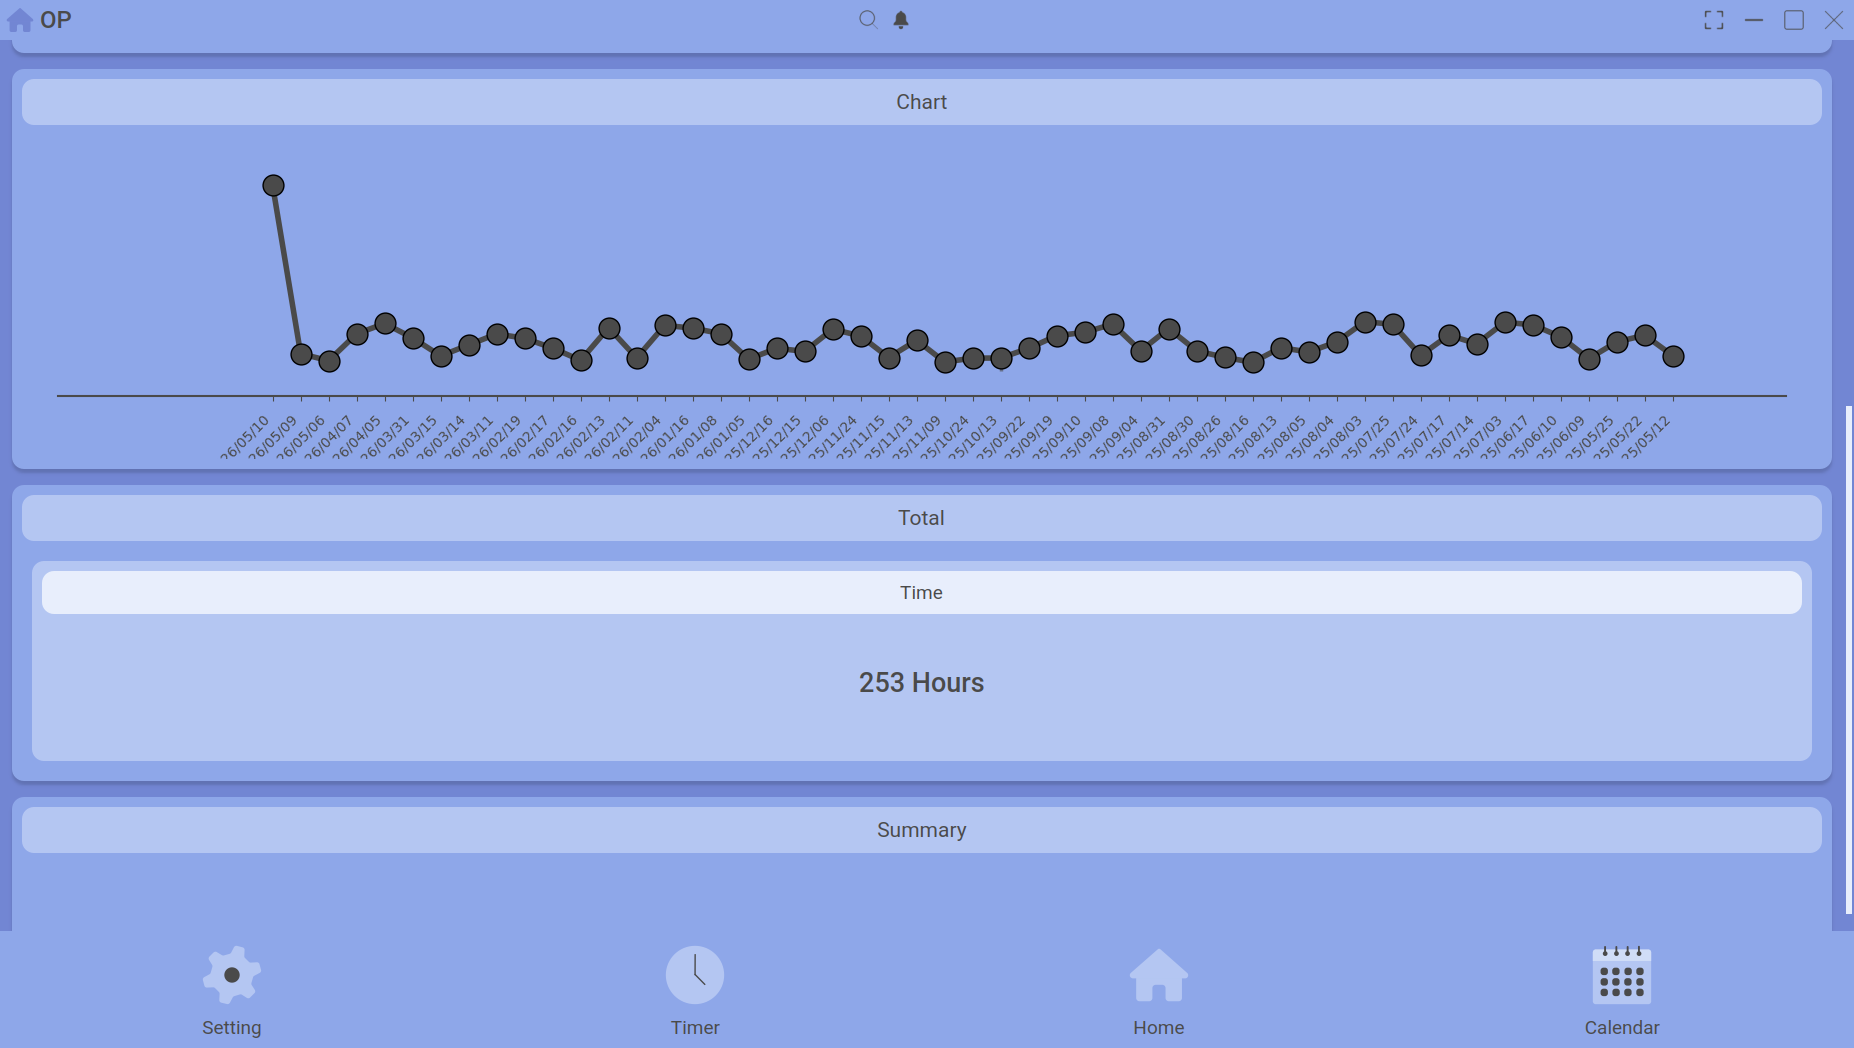
The lower half: charts and summary cards.
Continue reading: Activity Comparison (Average) and Activity Detail.